


All natural gas comes to the surface with water vapor. At this early stage of production, “wet gas” refers to natural gas. Gas dehydration is the process of separating this water from the gas in order to sell the “dry gas” for end use. The most common method of removing water from gas is glycol gas dehydration.
In this process, the gas is processed through triethylene glycol (“TEG”), which is heated. Through a series of processing vessels the glycol is heated. Next, it absorbs and processes out the water. Then the gas that remains is routed into a clean or dry gas line. A critical component of this process is the glycol pump.
One of the challenges for oil and gas producers in international markets is converting measurements from the imperial system to the metric system.
Below is a quick reference chart for natural gas dehydration featuring International Metric Measurements for glycol gas dehydration. If followed and used it should provide adequate gas dehydration to achieve outlet gas water content as desired. The glycol circulation rate in this chart is based on a conversion from a U.S. standard measure of 3 gallons of glycol required to remove 1 lb. of water from the gas stream.
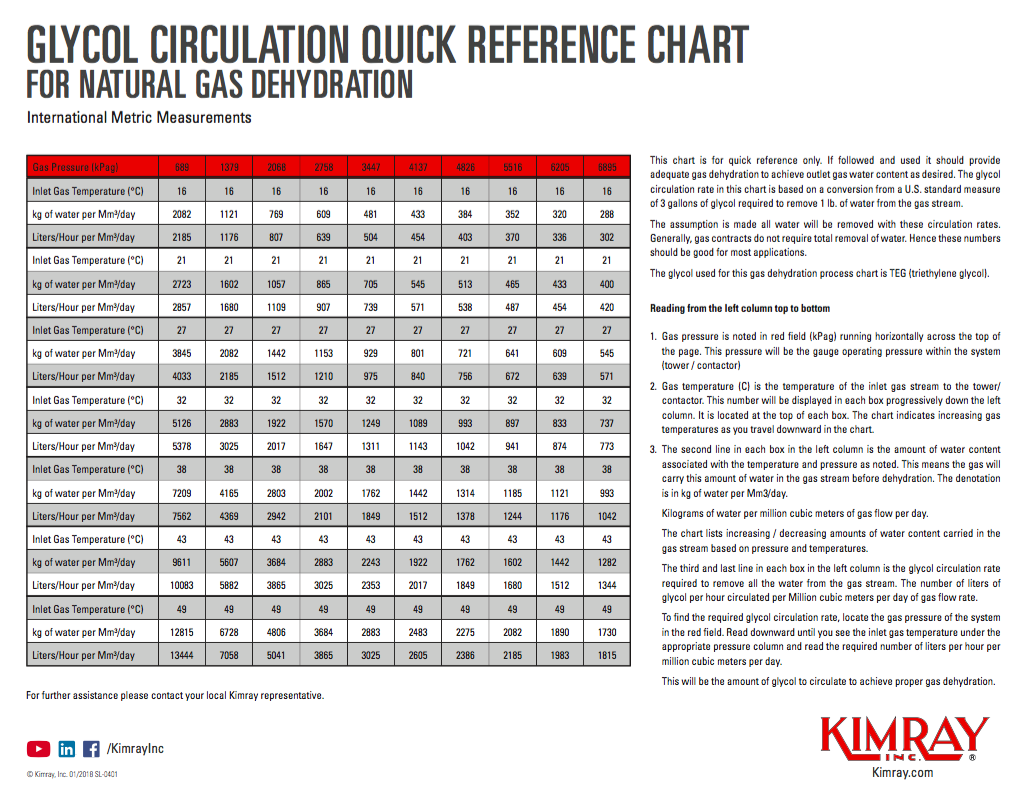
The assumption made is that these circulation rates rates will remove all water. Generally, gas contracts do not require total removal of water. Hence these numbers should be good for most applications.
The glycol used for this gas dehydration process chart is TEG (triethylene glycol).
Reading from the left column top to bottom:
- The red field (kPag), running horizontally across the top of the page, notes gas pressure. This pressure will be the gauge operating pressure within the system (tower / contactor)
- Gas temperature (C) is the temperature of the inlet gas stream to the tower/contactor. Each box progressively down the left column displays this number. It is located at the top of each box. The chart indicates increasing gas temperatures as you travel downward in the chart.
- The second line in each box in the left column notes the amount of water content associated with the temperature and pressure. This means the gas will carry this amount of water in the gas stream before dehydration. The denotation is in kg of water per Mm3/day.
Kilograms of water per million cubic meters of gas flow per day.
The chart lists increasing / decreasing amounts of water content carried in the gas stream based on pressure and temperatures.
The third and last line in each box in the left column is the glycol circulation rate which requires to removal of all the water from the gas stream. The number of liters of glycol per hour circulated per Million cubic meters per day of gas flow rate.
To find the required glycol circulation rate, locate the gas pressure of the system in the red field. Read downward until you see the inlet gas temperature under the appropriate pressure column and read the required number of liters per hour per million cubic meters per day.
This will be the amount of glycol to circulate to achieve proper gas dehydration.